Mike Sullivan
SIGMA Marketing Group has recently completed an analysis of past B2B campaigns and we have discovered some important findings that are now guiding our campaign designs. We discovered that prospects respond at a significantly lower rate than customers. It’s also clear that response rates vary by the methodology used to conduct the marketing touch, with email prospecting consistently performing at the lowest response rate. We found that prospect response rates vary depending on the relationship the company has with the prospect; for example, if the prospect is a past customer, they are more likely to respond then other prospects.
We categorized response expectation into three distinct groups:
1) prospects with no previous responses,
2) prospect with an existing relationship and
3) customers.
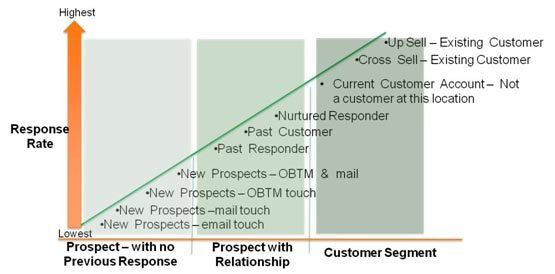
The chart below outlines those situations and relationships that affect response rates within those categories. The absolute level of the response rates will vary by the product category and type of industry, however, the relative position of the factor’s effect are fairly consistent across B2B campaigns.
Prospect with no Previous Response — Among this segment we found the response rates are influenced by the touch method used. The order of response rate performance from lowest to highest is: email, direct mail, outbound tele-marketing, with the highest being outbound tele-marketing with direct mail preceding the call. The direct mail included in the assessment was primarily letter or post card campaigns. We expected to see improved performance with 3-dimensional mail, but we had insufficient volume to evaluate the impact of 3-dimensional mail pieces.
Prospect with Relationship — For prospects that have a relationship with the company, the order of increasing response rate performance is: past responders, past customers and then nurtured responders. It was a surprise for some that past customers performed higher than pure prospects. However when you consider that they already have had experience with the company’s products and services, this simply means that they are more likely to consider repurchasing a product and brand that they are familiar with. So it’s clear that you should not lose contact with your past customers.
Customer Segment — The highest response rate we measured is from customers that are repurchasing more of the same product category. Cross selling existing customers shows the next highest response rate.
An important customer category that is often overlooked (and it’s low-hanging fruit) are sites that are not currently customers, but where other sites within their company are customers. When developing campaigns, we always include as many locations as we can that are site expansion targets within current customer accounts.
SIGMA Marketing Group has developed a number of analytic scoring models that define the likelihood of a site to purchase. We then calibrate the models to estimate the likelihood that the site will purchase a product in the next 12 months. This way our clients know whether the site has a 5% likelihood of purchasing or whether it has a .05% likelihood. Obviously, you are more willing to invest in targeting a company that has a 5% probability of purchasing rather than a 1 in 2000 probability of purchasing.
About the Author:
Mike Sullivan serves as VP of Account Development at SIGMA Marketing Group. Connect with Mike on .

